
Reporting that runs on your real data,
not a dashboard layer
Orbee Analytics is the reporting application built directly on the Orbee data infrastructure. Native reports, group-tier dashboards, source/medium attribution, and operational scorecards — all running on the same identity graph and event store that powers your activation.
Most "dealership analytics" is a wrapper around a generic web tool
Shallow data, wrong schema, segments that don't survive contact with reality. You end up exporting to Excel and rebuilding everything anyway.
Same definitions everywhere
The number you see in a dashboard is the number you get when you publish a segment. No reconciliation passes.
Native objectsReal-time, not batch
Reports load when you click them. Group rollups don't time out. Filters update in real time.
50–80msGroup-aware
Group-vs-store comparisons baked into every dashboard. Roll up across an entire dealer group with one click.
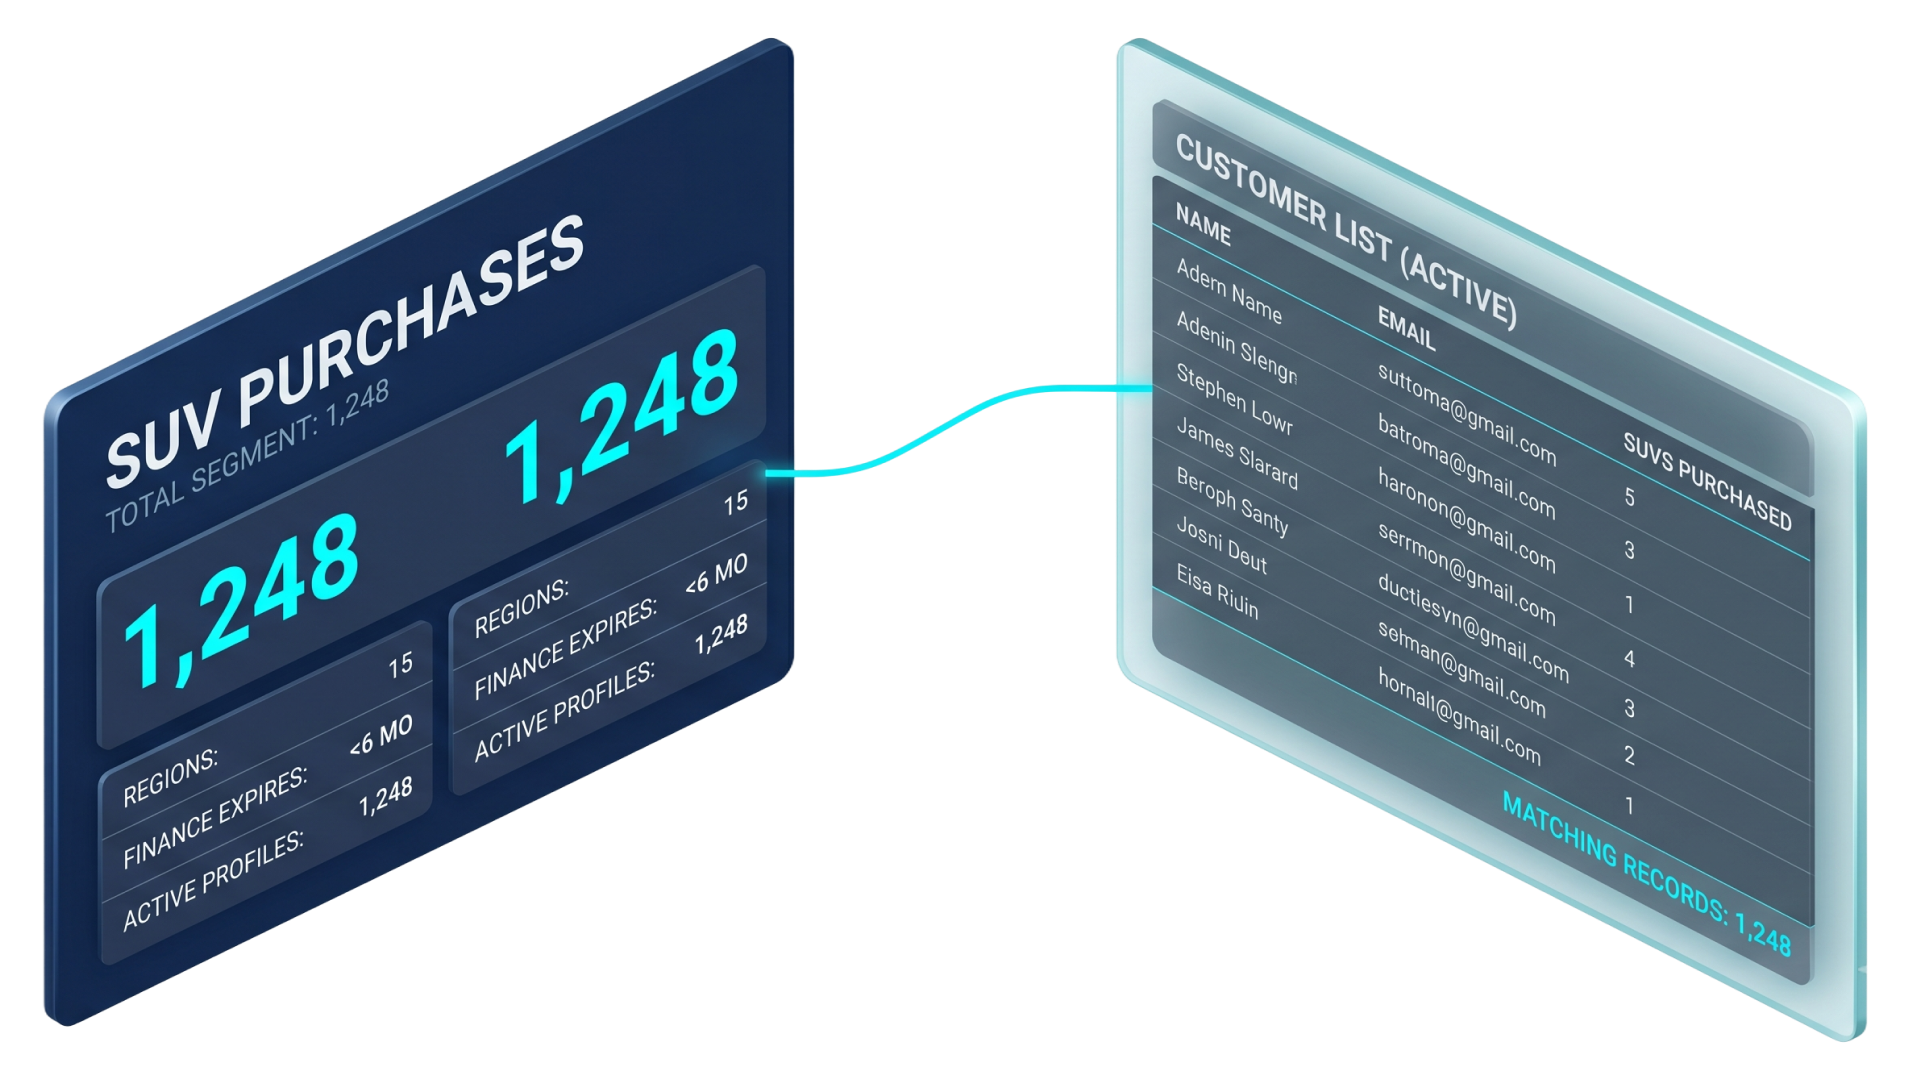
Multi-rooftopSpend → sold
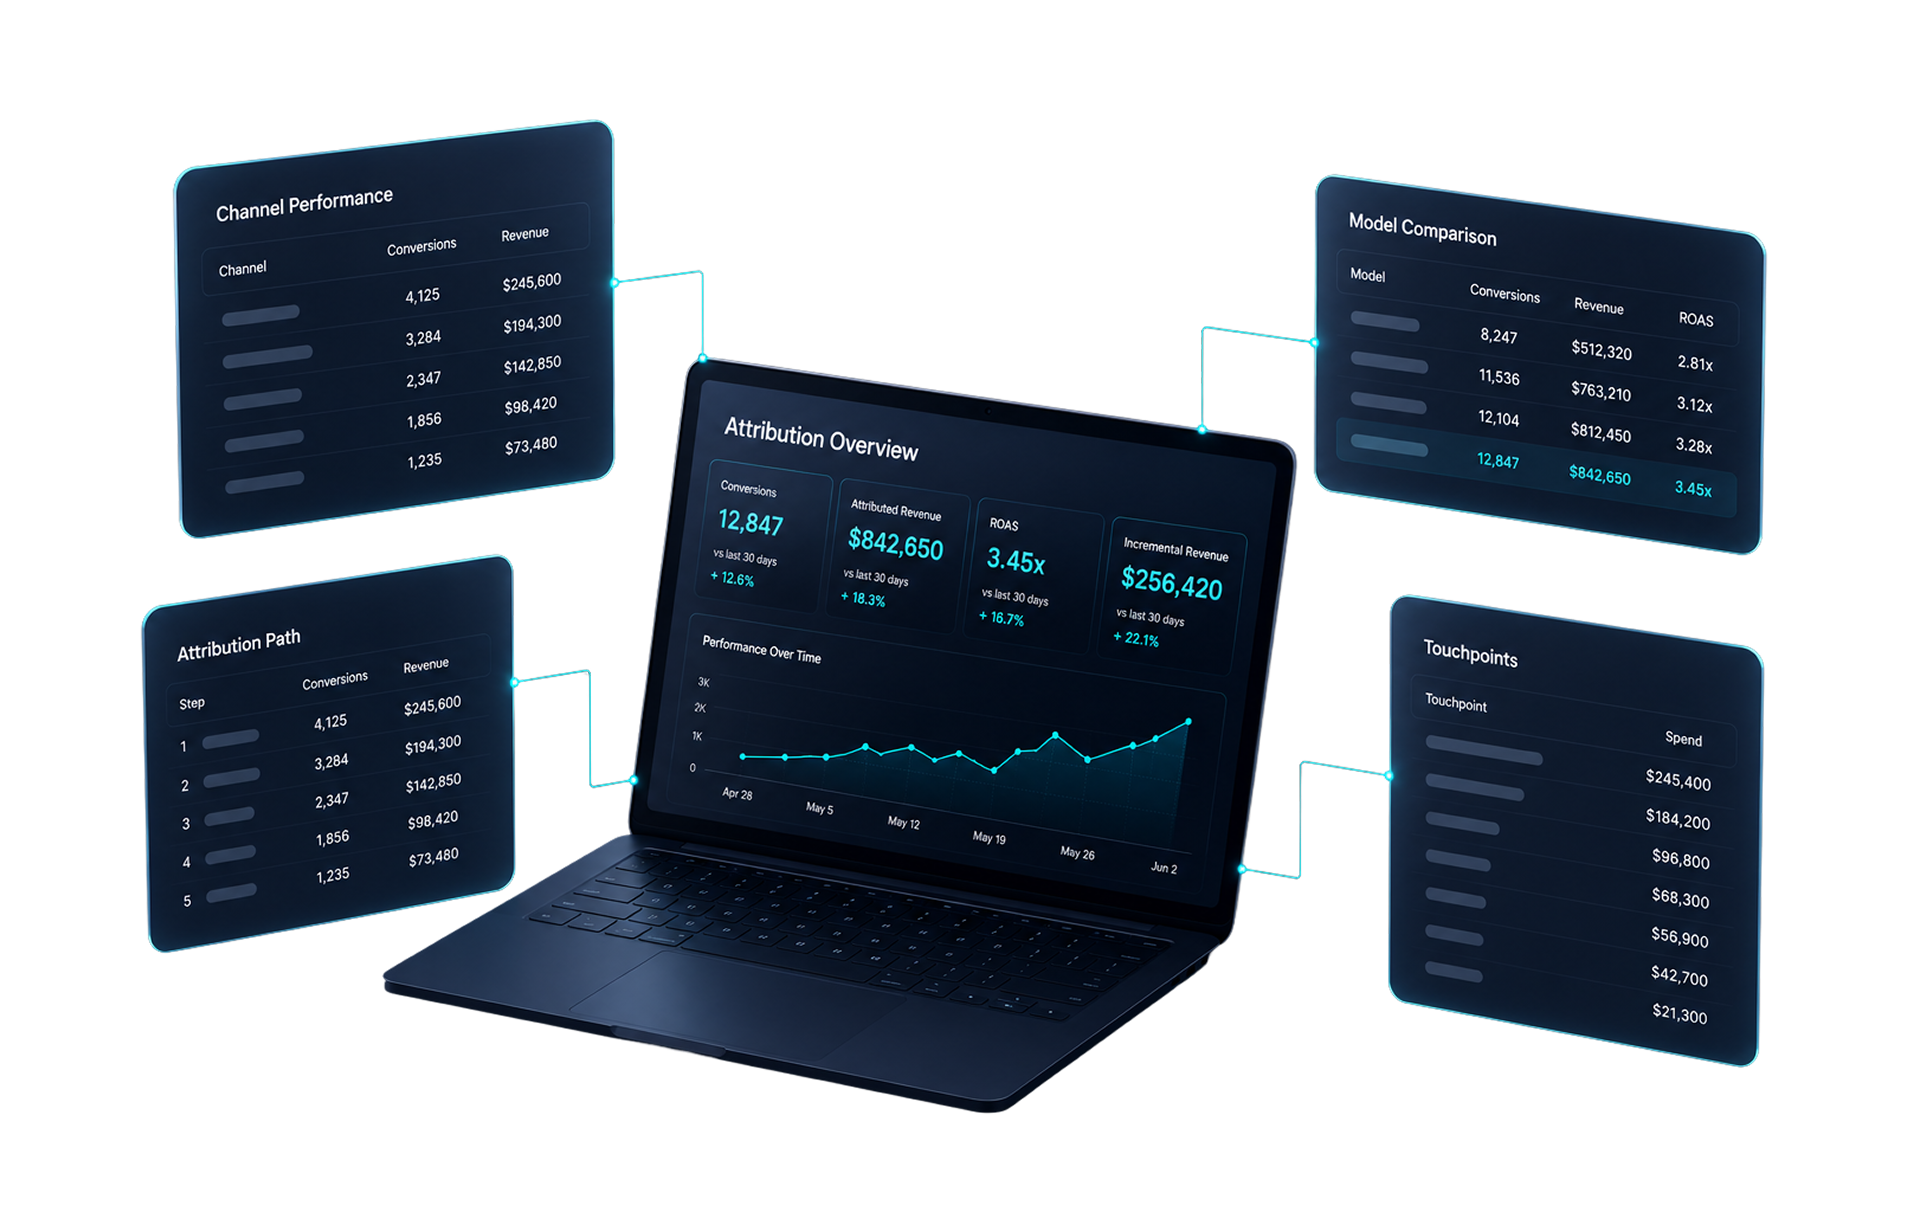
Source/medium attribution that ties paid spend to sold VINs, not just to form fills.
Closed loopNative reports plus a chart builder built on Studio
Pre-built reports for the metrics dealers actually care about, plus the freedom to build your own.
VDP, attribution, lead-to-sale, retention.
First-class reports with consistent data definitions across every rooftop — not saved charts that drift over time.
- VDP performance
- Source/medium attribution
- Service retention cohorts
- Multi-touch attribution
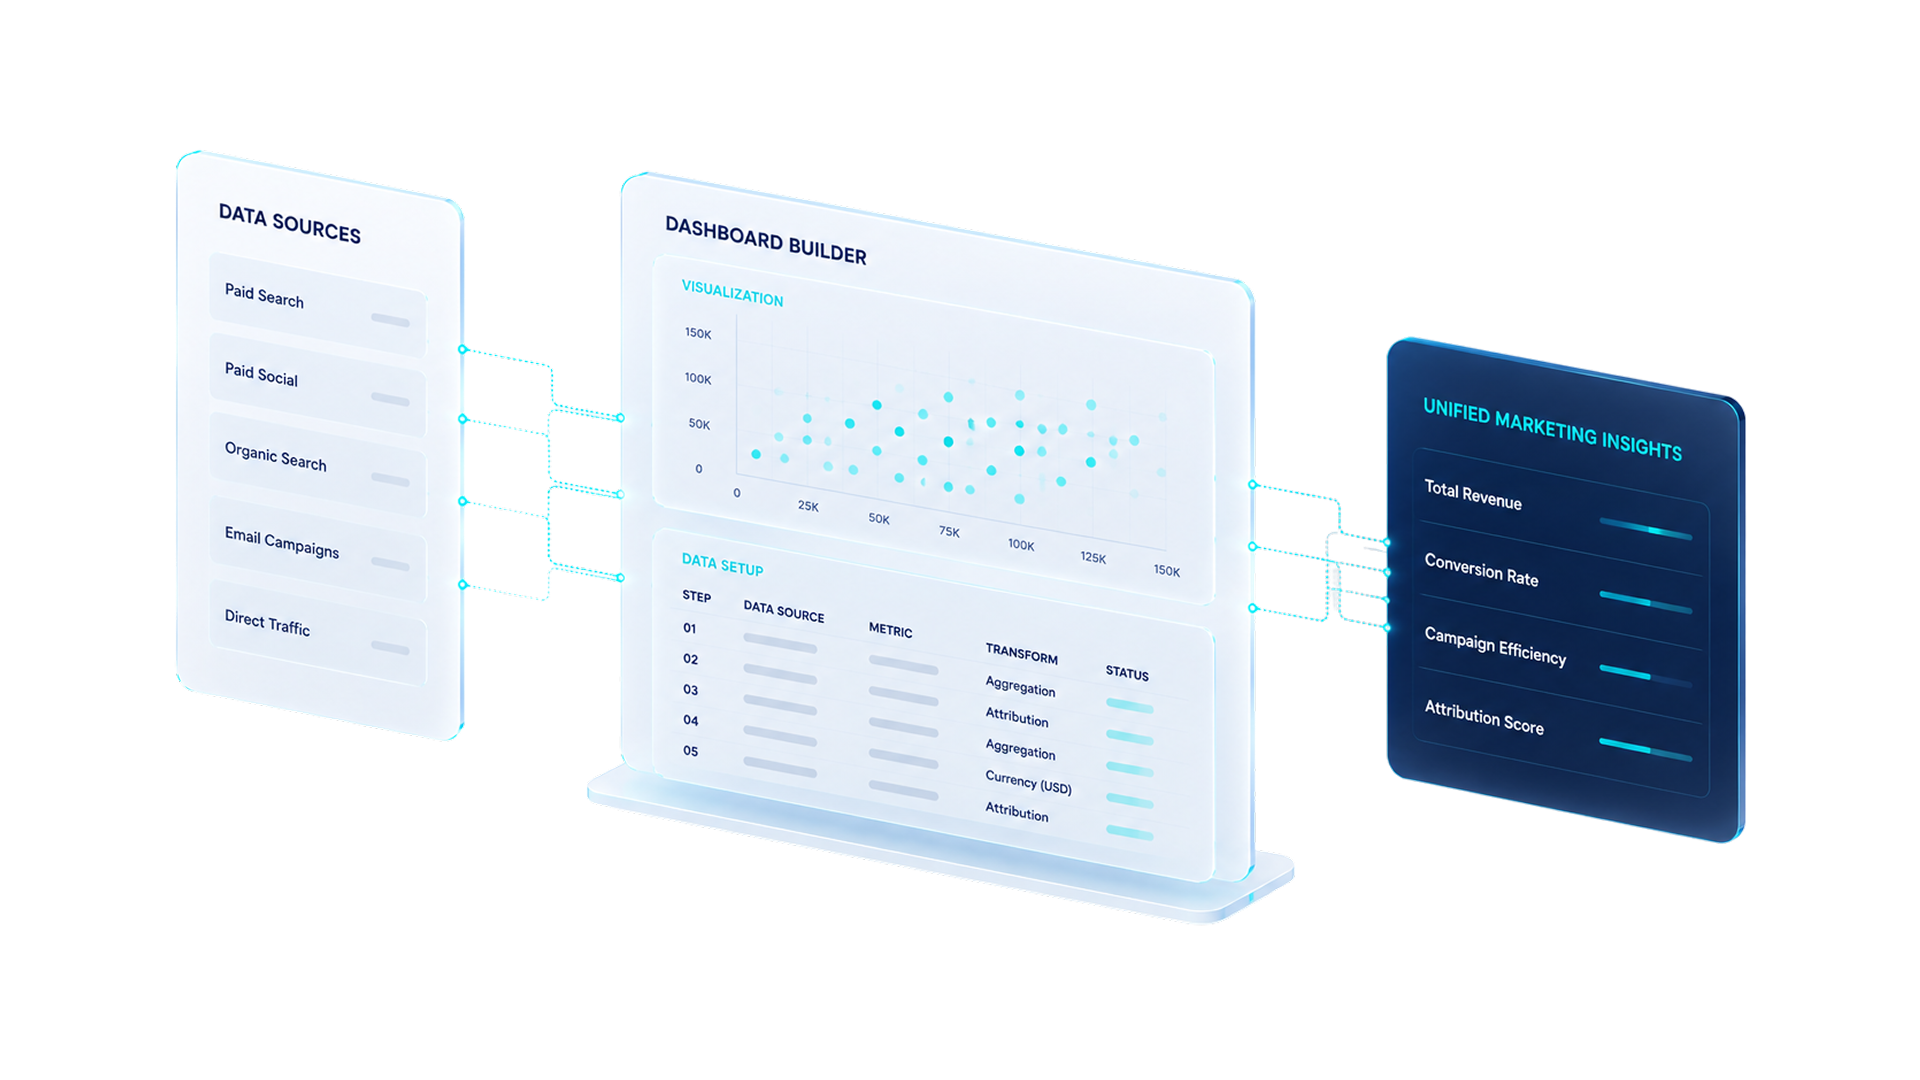
Studio doubles as a chart builder.
Pick columns, drag filters, choose a visualization. The same query that defines an audience can power a chart.
- Visual query builder
- Saved dashboards
- Scheduled email/Slack delivery
Velocity, age cohorts, stale-VIN alerts.
VDP-to-VIN engagement and inventory velocity running on real-time inventory feeds.
- Velocity by VIN cohort
- Stale-inventory alerts
- VDP engagement scoring
The same workspace your team uses to ship reports
Drop a dataset, pick columns, choose a chart type. Click around — after a few interactions we'll show you how to see it with your group's data.

| Dealer ID | Appointment ID | Scheduled Utc Date | Is Show | Is No Show |
|---|---|---|---|---|
| 12,693 | 128,558,186 | 2025-05-05T13:04:00Z | 0 | 0 |
| 12,693 | 128,583,794 | 2025-05-05T18:39:00Z | 0 | 1 |
| 12,693 | 128,608,495 | 2025-05-06T13:53:00Z | 0 | 1 |
| 12,693 | 128,630,078 | 2025-05-06T19:50:00Z | 0 | 1 |
| 12,693 | 128,649,718 | 2025-05-07T14:15:00Z | 1 | 0 |
| 12,693 | 128,708,079 | 2025-05-08T18:25:00Z | 1 | 0 |
| 12,693 | 128,715,447 | 2025-05-08T20:19:00Z | 1 | 0 |
| 12,693 | 128,755,854 | 2025-05-09T18:42:00Z | 0 | 1 |
| 12,693 | 128,756,901 | 2025-05-09T18:56:00Z | 0 | 0 |
| 12,693 | 128,804,514 | 2025-05-10T19:49:00Z | 1 | 0 |
| 12,693 | 128,838,283 | 2025-05-12T16:38:00Z | 1 | 0 |
| 12,693 | 128,839,088 | 2025-05-12T16:49:00Z | 1 | 0 |
| 12,693 | 128,846,226 | 2025-05-12T18:24:00Z | 1 | 0 |
| 12,693 | 128,895,834 | 2025-05-13T20:06:00Z | 1 | 0 |
| 12,693 | 128,920,140 | 2025-05-14T15:40:00Z | 1 | 0 |
| 12,693 | 128,968,643 | 2025-05-15T17:02:00Z | 1 | 0 |
| 12,693 | 128,972,826 | 2025-05-15T18:03:00Z | 1 | 0 |
| 12,693 | 128,973,118 | 2025-05-15T18:08:00Z | 1 | 0 |
A clean view for whoever's looking at it
From group leadership to service managers, every team gets a tier-appropriate view of the same underlying data.
GMs & group leadership
Clean, consistent group-tier scorecards — without filtering out the "too nerdy" details every time.
Marketing managers
Source/medium attribution that ties paid spend to sold VINs, not just to form fills.
Service managers
Retention cohorts, lapsed-service segments, and service-to-sales handoff reports.
See Analytics with your group's data sources connected.
Live walkthrough with your data, in under 30 minutes.
Real-time queries · Group-tier dashboards